
In the previous article, we started studying how the attendance reader client works, we even attempted to decompile its executable. In this article, I’d like to explore the communication protocol that the client uses to talk to the reader.
There are basically two reasons why I didn’t immediately reverse-engineer the protocol:
- If I could decompile the executable code, I could create an alternative client much more easily;
- Sometimes it’s not possible (not easily, at least) to sniff a communication ‘cause of TLS.
However, decompiling DLLs is far from easy because:
There’s no magic “go back” button, there’s a “generate shitty C code with random-ass variable names” button, but that’s not a very good button
fasterthanlime in the How does the detour crate work? video
If you’re interested, the NSA has developed its own decompiler called Ghidra, check it out.
Client configuration #
In the last article, we only installed the client for Windows but never opened it.
Since we need a client that can actually interact with the reader to intercept the communication, I reopened my VM with Windows 10 AME and finished configuring the client:
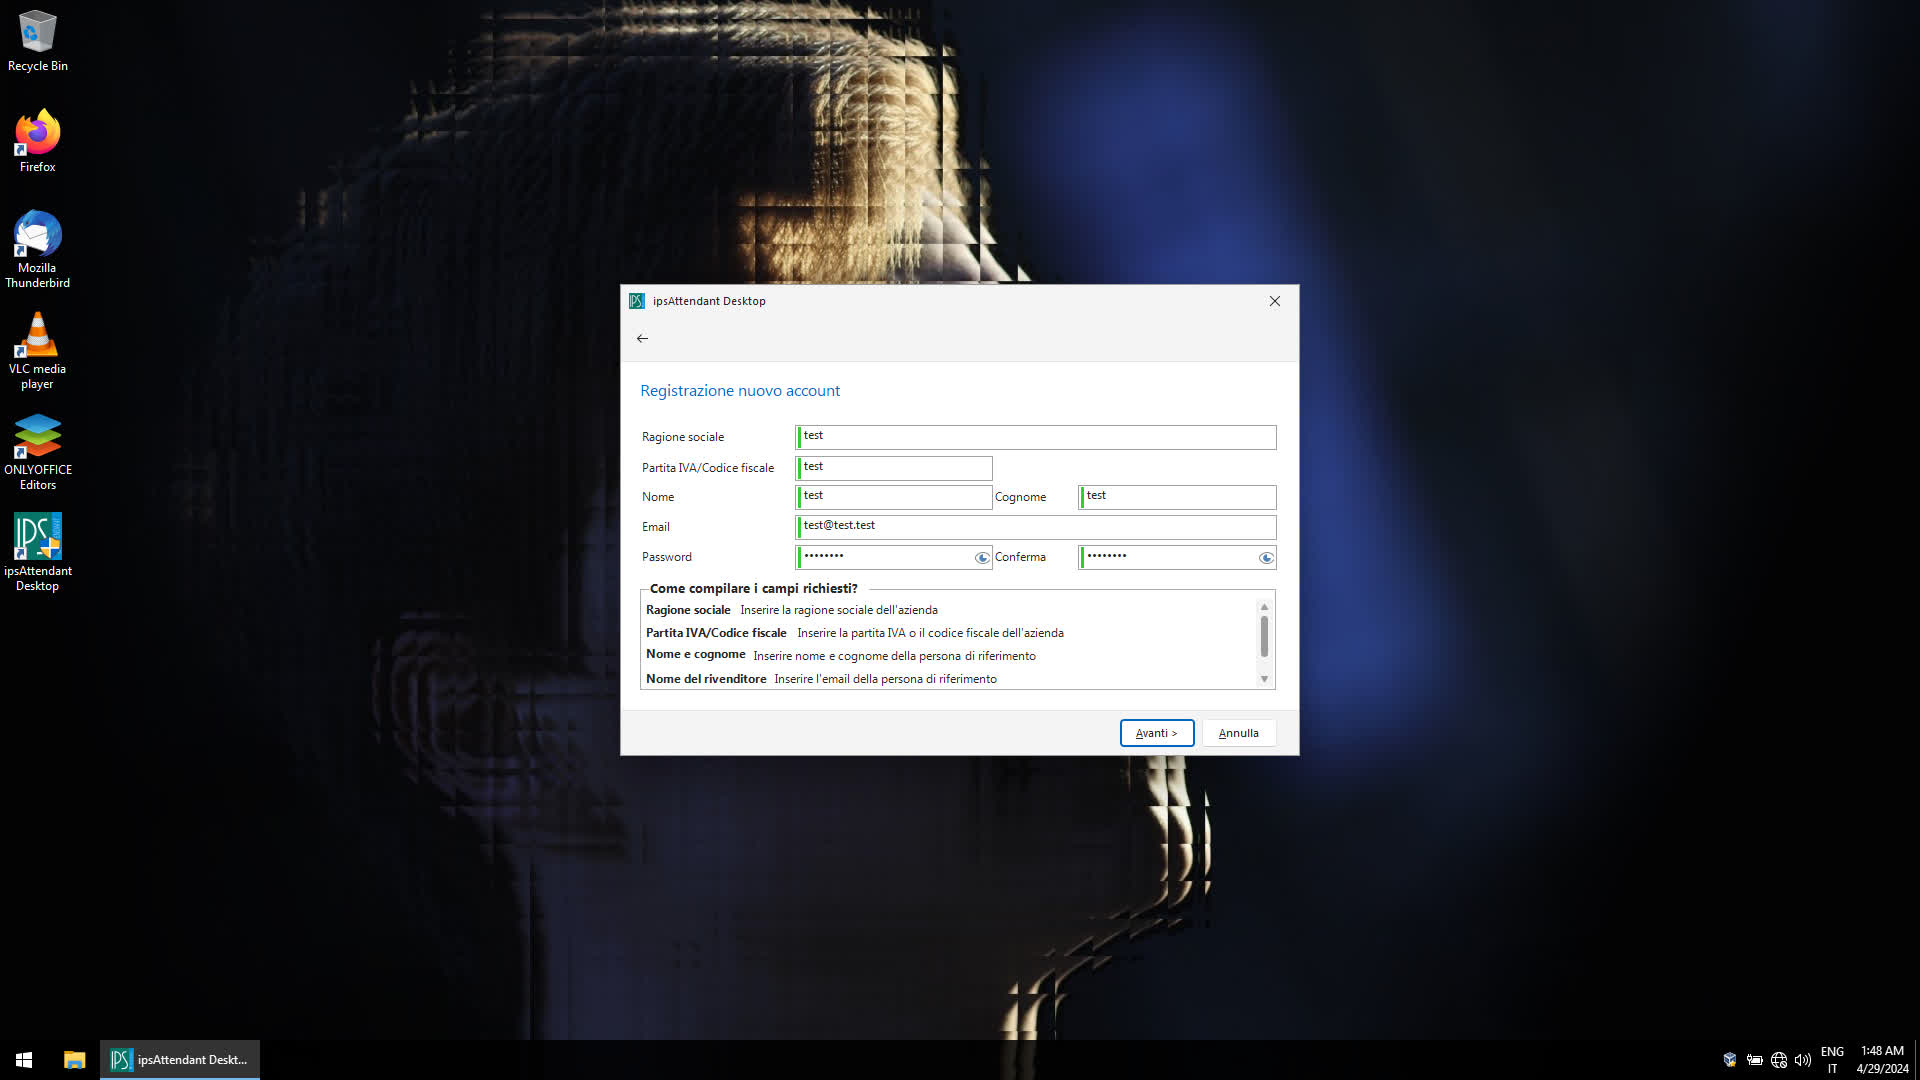
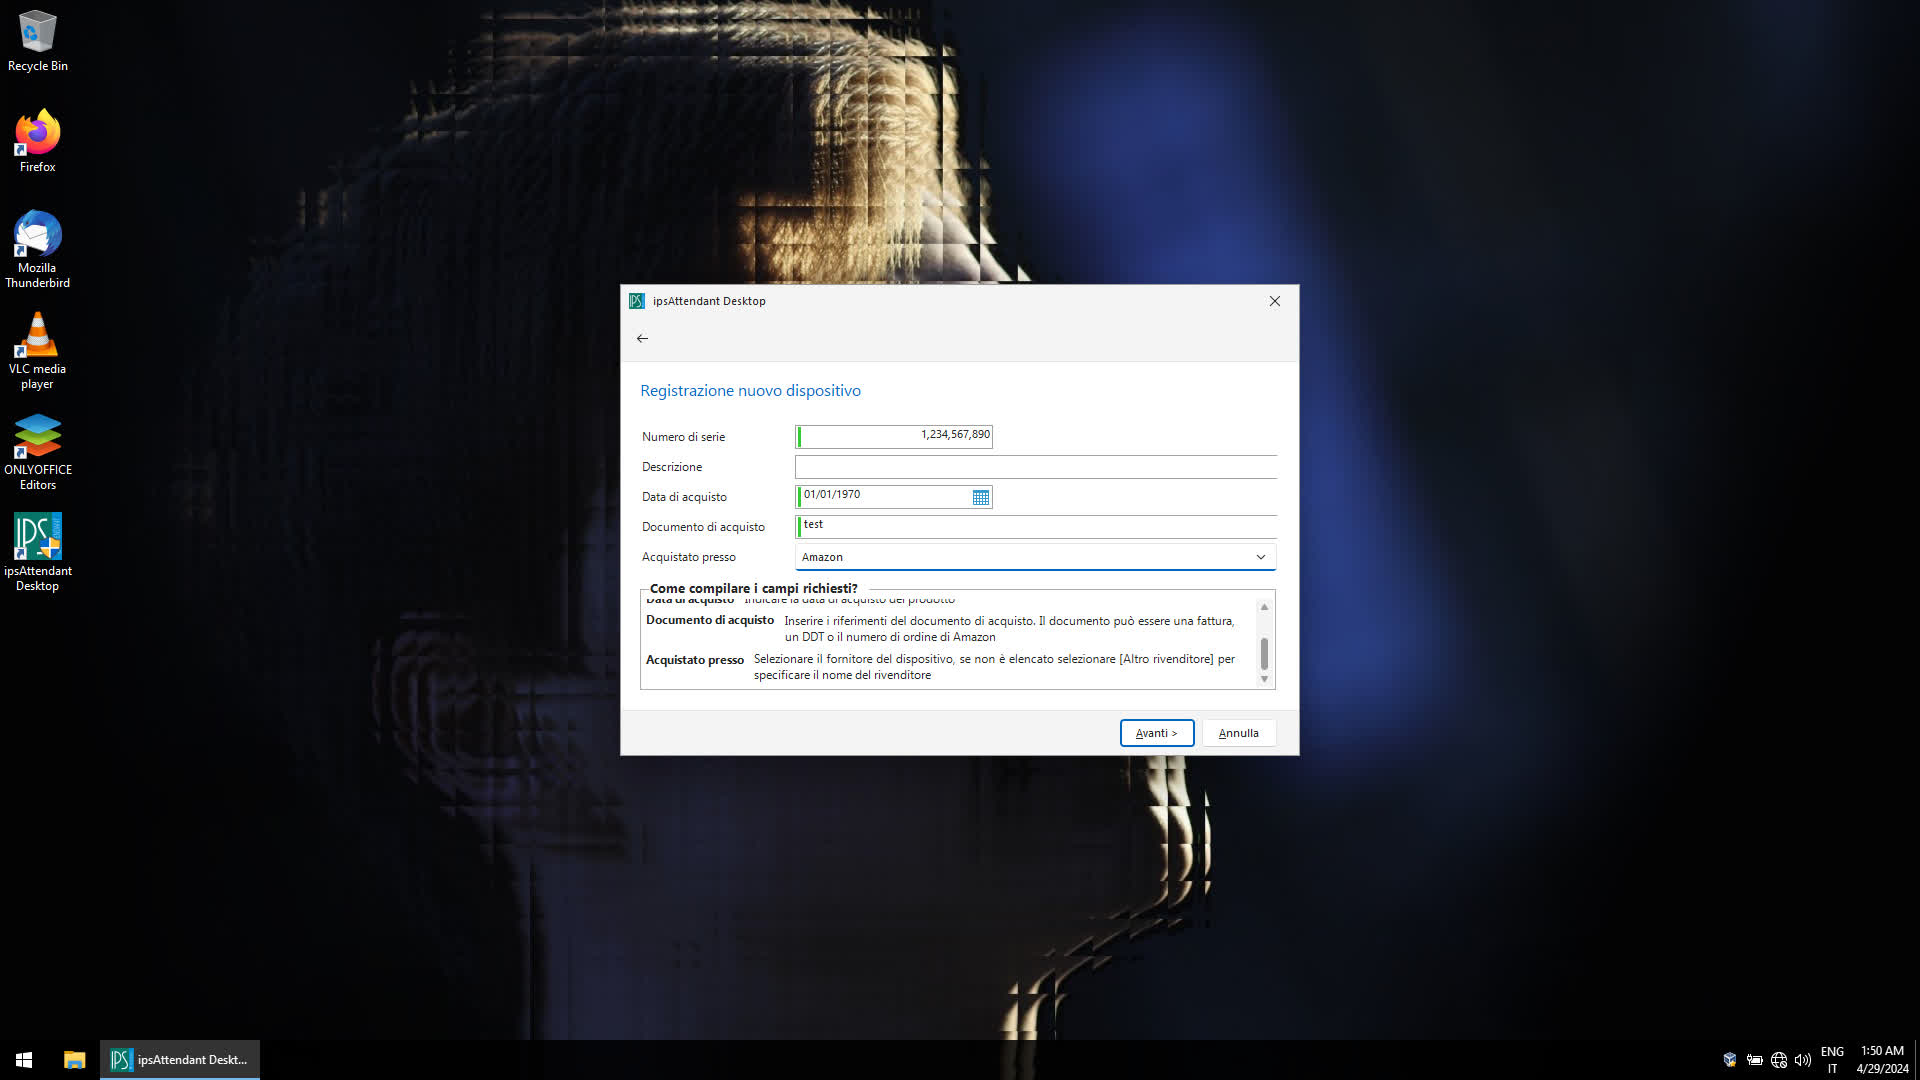
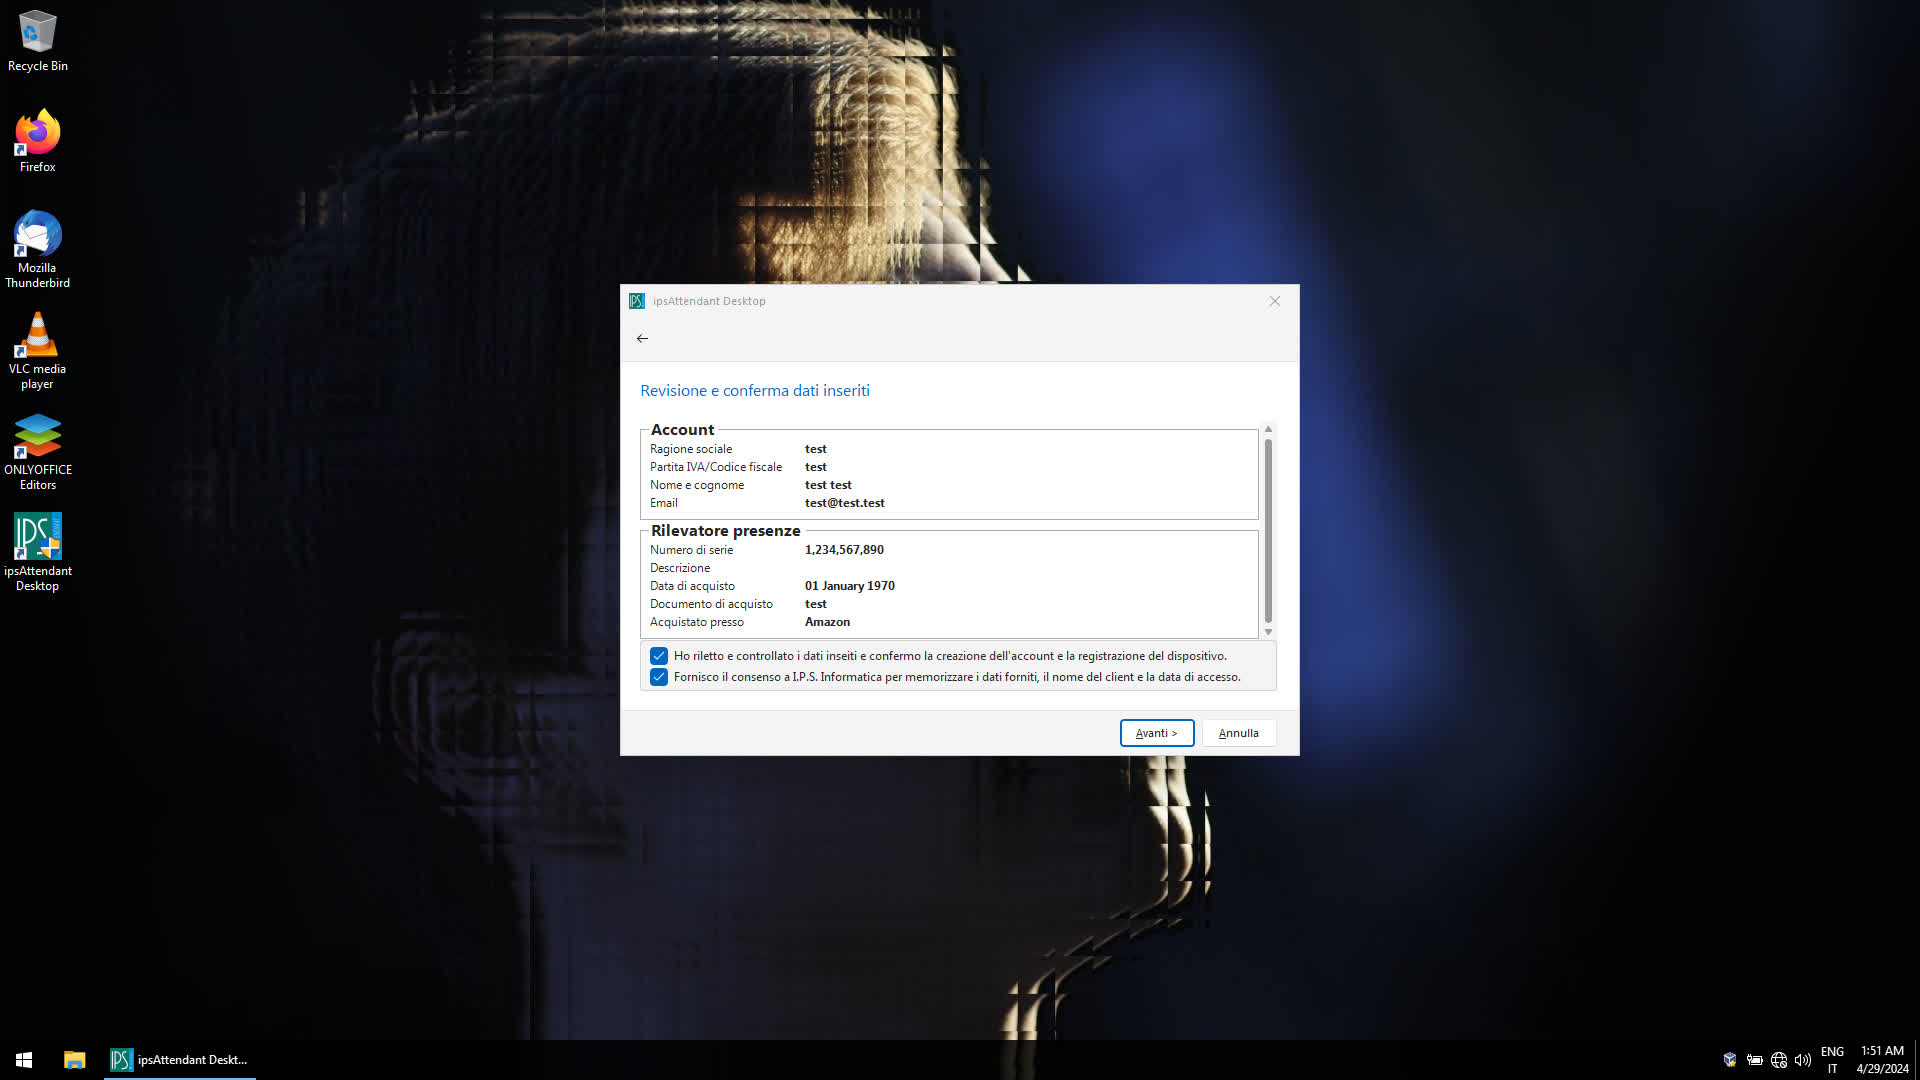
Once the configuration is completed (and after manually modifying some configuration files because the client still couldn’t see the reader on the network), we can request the reader’s data over the network.
After opening the client as an administrator, pressing the button to download data, and waiting two minutes, a total of 3543 attendances appeared on the screen.
Something’s odd: why does it take two minutes to transfer the equivalent of a file weighing just under 200 kiB?
Doing some quick math:
$$ \frac{3543\ \textrm{lines}}{120\ \textrm{seconds}} \ \cdot\sim460\ \textrm{bit per row} = 13.26\ kib/s $$
13 kibps of useful throughput on a 100 Mbps connection? This sucks!
I don’t want to know what disaster of italian corporate coding could have caused this, but I have a feeling I’m about to find out…
The quieter you become… #
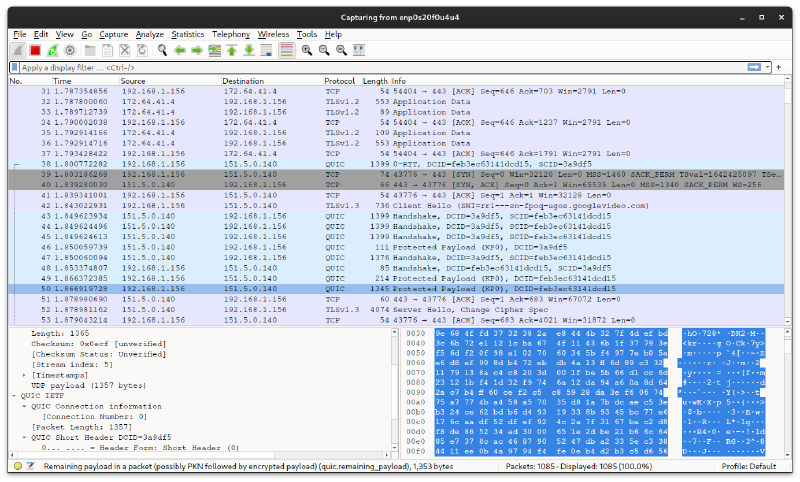
To analyze the network, I will use Wireshark, a very popular tool for this type of operations.
After installing it and adding our user to the wireshark group, we can run it
and begin to sniff all packets on our network interface.
If this is your first time using a tool like this, you might notice that even in a small Local Area Network there are a lot of packets flying around — too many to analyze individually.
This is where filters come and save the day. If we type the following string into the filter bar:
ip.addr == <Device's IP>We will see only packets that come from or are directed to the specified IP address. We can also filter traffic that passes through a specific TCP port with:
ip.addr == <IP> && tcp.port == <Port>Filters in Wireshark are a vast argument; here’s a link to the official documentation for those interested.
Once we start recording with the correct filters, we can start another full scan of attendances on the official client, and we should see the packet exchange between the client and the device in real-time.
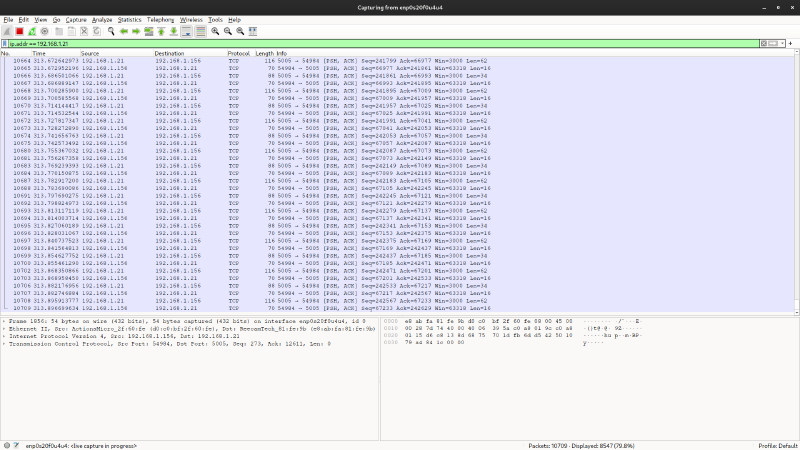
At the end of the process, we’ve recorded an astonishing 14,423 packets, carrying 3,543 attendances. Things just get stranger…
By taking a quick look at the traffic, we can deduce a few things:
- The transport layer uses the TCP protocol on port
5005; - TLS is not used, phew;
- There are at least three phases:
- An initial setup phase;
- A second phase in which data is exchanged with a few but large packets;
- A third phase with many but small packets, where you can occasionally observe employee names in ASCII.
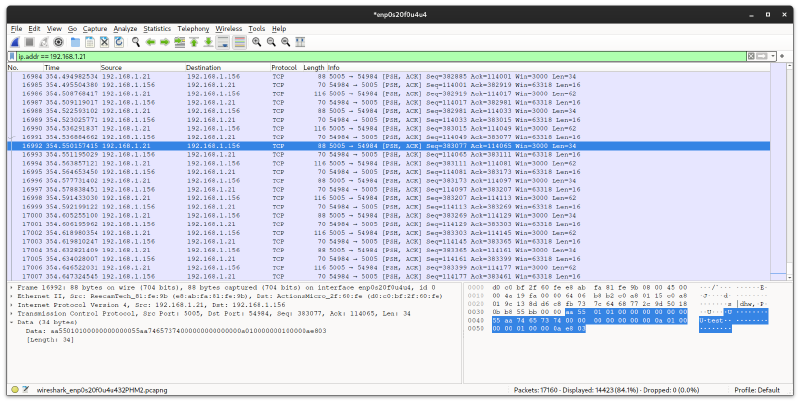
To study the protocol in more depth, we’d need only the content of the TCP packets. This is where Wireshar comes in handy.
If we select a packet from the TCP communication we’re interested in and
right-click, selecting Follow > TCP Stream, Wireshark will automatically
open the payload of all packets and show only the level-7 traffic.
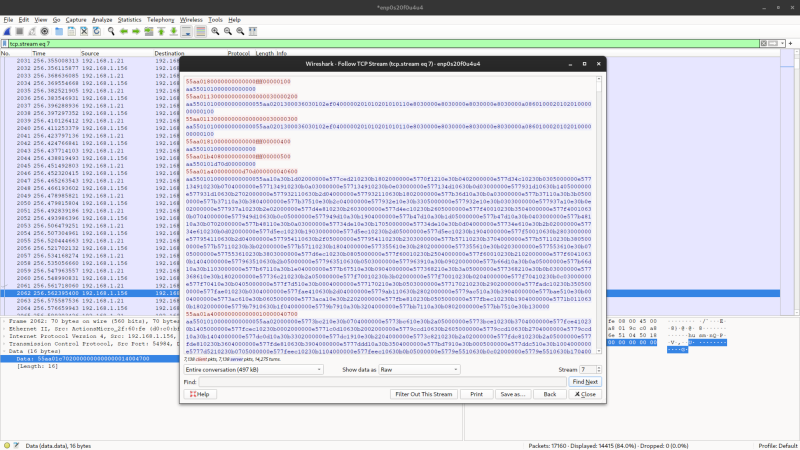
If we view the data as Raw, Wireshark will display the exchanged data in
hexadecimal format, with messages sent by the client in red and responses from
the attendance reader in blue.
Now we can copy the payloads into our preferred text editor and start to study the protocol.
Fuck around and find out #
Now we just need to understand the communication protocol, which, unfortunately, isn’t in a text-based format like ASCII or UTF-8.
It may seem complex, but it only took me an afternoon to find a comprehensive enough solution for what I need to do.
Requests #
Client requests are all 16 bytes long and have this structure:
^55aa([0-9a-f]{24})([0-9a-f]{4})$- The first two bytes are always
55 aa(01010101 10101010in binary); - The next 12 bytes specify the client command. I will call them “payload” from now on;
- Finally, there are two little-endian bytes indicating the packet number,
starting from
00 00.
I noticed that the server doesn’t check if the last two bytes are sent
sequentially, so they can remain at 00 00 throughout the message exchange.
Responses #
Server responses do not have a fixed length and are divided into two parts, which I will call “header” and “payload.” The header is always present and is 10 bytes long, while the payload can be absent.
When there’s no payload, the message acts like a kind of null/ACK.
^aa55([0-9a-f]{16})(?:55aa([0-9a-f]+))?$- The first two bytes are always
aa 55(10101010 01010101in binary); - The following eight bytes are the header. Usually, they are
01 01 00 00 00 00 00 00, but they can change; - If a payload is present, the message continues with
55 aa(01010101 10101010in binary); - The remaining bytes are the payload.
Ping #
If we want to perform a “ping” and check if the server responds, we can send a
request with the payload set to 01 80 00 00 00 00 00 00 00 00 00 00:
55aa0180000000000000000000000100
aa550101000000000000
The server will then respond with a packet without a payload and the header set
to 01 01 00 00 00 00 00 00.
Employee name #
Knowing the ID of an employee, it’s possible to ask the server for their name
by sending a request with a payload set to 01 c7 xx xx xx xx 00 00 00 00 14 00, where xx xx xx xx is a 32-bit little-endian integer representing the
employee ID.
55aa01c7xxxxxxxx0000000014000100
aa55010100000000000055aaxxxxxxxxxxxxxxxxxxxx4c0000000000595a7c7c0000
If the response header is set to 01 00 00 00 00 00 00 00, then this means
that the username was not found. However, if it is set to 01 01 00 00 00 00 00 00, then the first 10 bits of the payload represent the employee’s name.
If the name is shorter than 10 characters, the remaining space will be filled
with null-terminator characters \0.
These messages comprise almost the entirety of the third phase I described in the last chapter, the one with many but small messages. This suggests that the client quickly dumps the attendance data, then spends two whole minutes downloading the employee’s name for each attendance, even if it’s been requested before. Someone should teach these developers the concept of memoization…
Total number of records #
To ask for the total number of attendances registered on the device, you need
to send a request with a payload of 01 b4 08 00 00 00 00 00 ff ff 00 00:
55aa01b4080000000000ffff00000100
aa550101xxxx00000000
Where xx xx is the number of saved attendances represented as a 16-bit
little-endian integer.
65535 maximum requests seem a bit too few, but I guess it’s a future-me problem.
Downloading all records #
The list of all attendances must be downloaded in blocks, continuing to request 1024-byte blocks from the server (approximately 85.333 attendances at a time) until the entire list is extracted.
To do this, we first have to request the total number of attendances, then send
a request with a payload of 01 a4 00 00 00 00 xx xx 00 00 00 04, where xx xx is the total number of attendances in little-endian.
55aa01a400000000xxxx000000040100
aa55010100000000000055aa ...
The server will respond with a 1026-byte payload, containing the initial records followed by two zero bytes.
We can request another 1026-byte block by sending a request with a payload of
01 a4 00 00 00 00 00 00 xx xx 00 04, where xx xx is a little-endian
integer starting from 01 00:
55aa01a4000000000000010000040100
aa55010100000000000055aa ...
Once the records are finished, the server will start sending padding bytes set
to ff to reach 1026-byte.
Record structure #
Once we have all the registration blocks, we can break them down into individual registrations, each one 12 bytes long. I wasn’t able to understand what all the bytes represent, but the important ones are:
..([26ae]).{5}([0-9a-f]{8})([0-9a-f]{8})- The second byte’s two most significant bits indicate if the registration
represents an entry or an exit:
- If it’s
00, it’s the first entry; - If it’s
01, it’s the first exit; - If it’s
10, it’s the second entry; - If it’s
11, it’s the second exit;
- If it’s
- The second-to-last four bytes represent the employee ID (in little-endian);
- The last four bytes represent the date and time of the attendance (in little-endian).
Initially I thought the date was represented as a UNIX Epoch, but it seems to have this format when shown as big-endian:
- The first 6 bits represent the minutes;
- The next 5 bits represent the hours;
- The next 5 bits represent the days;
- The next 4 bits represent the months;
- The last 12 bits represent the years.
I suspect that the first four bytes of each attendance may contain:
- The seconds;
- The recording method (if the employee checked-in with the PIN, fingerprint, or the badge);
- The recorder ID.
But since these aren’t very important fields, I’ve decided to ignore them for now.
Testing using the terminal #
If you want to test communication without writing any program that sends bytes
over a TCP socket, you can use some basic core utilities like netcat and
xxd:
# If you're using Bash or Zsh
function send_bytes { echo -n "$3" | xxd -r -p | timeout 1 nc "$1" "$2" | xxd; }

# If you're using Fish
function send_bytes -a ip port data
    echo -n "$data" | xxd -r -p | timeout 1 nc "$ip" "$port" | xxd
end

send_bytes 127.0.0.1 5005 55aa0180000000000000000000000100
Trying some requests from the examples above, I can confirm everything seems to work correctly. In the next article, we’ll see how to create a small Rust library to extract data from the reader.